
Learning Objectives
- Label the roots, nodes, branches, and tips of a phylogenetic tree
- Identify monophyletic groups, including nested monophyletic groups, and distinguish from non-monophyletic groups
- Identify synapomorphies that identify a monophyletic group
- Find and use the most recent common ancestor of any two given taxa to evaluate the relatedness of extant and extinct species
- Provide examples of the different types of data incorporated into phylogenetic trees, and recognize how these data are used to construct phylogenetic trees
What is a phylogenetic tree?
A phylogenetic tree is a visual representation of the relationship between different organisms, showing the path through evolutionary time from a common ancestor to different descendants. Trees can represent relationships ranging from the entire history of life on Earth, down to individuals in a population.
The diagram below shows a tree of 3 taxa (a singular taxon is a taxonomic unit; could be a species or a gene).

This is a bifurcating tree. The vertical lines, called branches, represent a lineage, and nodes are where they diverge, representing a speciation event from a common ancestor. The trunk at the base of the tree, is actually called the root. The root node represents the most recent common ancestor of all of the taxa represented on the tree. Time is also represented, proceeding from the oldest at the bottom to the most recent at the top. What this particular tree tells us is that taxon A and taxon B are more closely related to each other than either taxon is to taxon C. The reason is that taxon A and taxon B share a more recent common ancestor than they do with taxon C. A group of taxa that includes a common ancestor and all of its descendants is called a clade. A clade is also said to be monophyletic. A group that excludes one or more descendants is paraphyletic; a group that excludes the common ancestor is said to be polyphyletic.
Monophyletic versus non-monophyletic groups
The image below shows several monophyletic (top row) versus polyphyletic (bottom left) and paraphyletic (bottom right) trees. Notice how the clades include the common ancestor and all of its descendants (the green and blue examples), while those labeled “not a clade” leave out some common ancestors (polyphyletic in red) or some descendants (paraphyletic in orange).
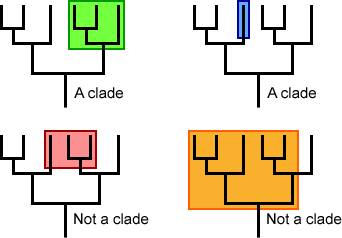
The members of a monophyletic group share traits that evolved along an ancestral branch. The shared, derived trait is called a synapomorphy.

The video below focuses on terminology and introduces some misconceptions about reading trees:
Misconceptions and how to correctly read a phylogenetic tree
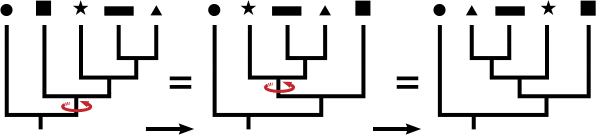
Trees can be confusing to read. A common mistake is to read the tips of the trees and think their order has meaning. To drive home this point, in the tree below notice how the closest relative to taxon C is not taxon B.

Both A and B are equally distant from, or related to, taxon C. In fact, switching the labels of taxa A and B would result in a topologically equivalent tree. It is the order of branching along the time axis that matters. The illustration below shows how rotating the branches does not affect the structure of the tree, much like an inverted hanging mobile:

It can also be difficult to recognize how the trees model evolutionary relationships. One thing to remember is that any tree represents a minuscule subset of the tree of life.
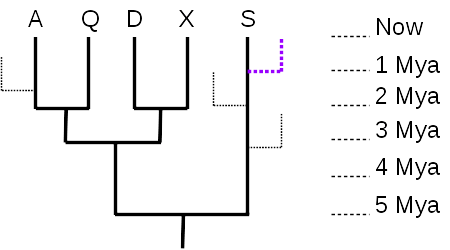
Given just the 5-taxon tree (no dotted branches), it is tempting to think that taxon S is the most “primitive” or most like the common ancestor represented by the root node, because there are no additional nodes between S and the root. However, there were undoubtedly many branches off that lineage during the course of evolution, most leading to extinct taxa (99% of all species are thought to have gone extinct), and many to living taxa (like the purple dotted line) that are just not shown in the tree. What matters, then, is the total distance along the time axis (vertical axis, in this tree) – taxon S evolved for 5 million years, the same length of time as any of the other 4 taxa. As the tree is drawn, with the time axis vertical, the horizontal axis has no meaning, and serves only to separate the taxa and their lineages. So none of the currently living taxa are any more “primitive” nor any more “advanced” than any of the others; they have all evolved for the same length of time from their most recent common ancestor.
The time axis also allows us to measure evolutionary distances quantitatively. The distance between A and Q is 4 million years (A evolved for 2 million years since they split, and Q also evolved independently of A for 2 million years after the split). The distance between A and D is 6 million years, since they split from their common ancestor 3 million years ago.
Phylogenetic trees can have different forms – they may be oriented sideways, inverted (most recent at bottom), or the branches may be curved, or the tree may be radial (oldest at the center). Regardless of how the tree is drawn, the branching patterns all convey the same information: evolutionary ancestry and patterns of divergence.
This video does a great job of explaining how to interpret species relatedness using trees, including describing some of the common incorrect ways to read trees:
Data used to construct trees
Many different types of data can be used to construct phylogenetic trees, including morphological data, such as structural features, types of organs, and specific skeletal arrangements; and genetic data, such as mitochondrial DNA sequences, ribosomal RNA genes, and any genes of interest.
These types of data are used to identify homology, which means similarity due to common ancestry. This is simply the idea that you inherit traits from your parents, only applied on a species level: all humans have large brains and opposable thumbs because our ancestors did; all mammals produce milk from mammary glands because their ancestors did.
Trees are constructed on the principle of parsimony, which is the idea that the most likely pattern to is the one requiring the fewest changes. For example, it is much more likely that all mammals produce milk because they all inherited mammary glands from a common ancestor that produced milk from mammary glands, versus multiple groups of organisms each independently evolving mammary glands.
Here is an excellent resource on phylogenetic trees: https://evolution.berkeley.edu/evolibrary/article/0_0_0/evotrees_intro

UN Sustainable Development Goal

SDG 2 Zero Hunger – Understanding relatedness is important to the aim of ending hunger, achieving food security, and improving nutrition and sustainable agriculture. Determining the evolutionary relationships and relatedness within and between different plant species can aid in the development of sustainable agricultural practices and the preservation of crop diversity, which is essential for food security.
