
Learning Objectives
- Explain how predators and prey control each other’s populations using graphs and equations
- Describe the concept of keystone species, provide examples of how a keystone species is responsible for community species composition, and refute misconceptions about keystone species
- Sketch a graph of the simple model of island biogeography, and predict effects of island size and distance from a mainland source in determining number of species at equilibrium
- Compare species diversity indices between communities, and identify effects of low diversity communities on community function
Predators and Prey: A closer look
A well-studied predator-prey example is the lynx-hare interaction in the Canadian arctic.
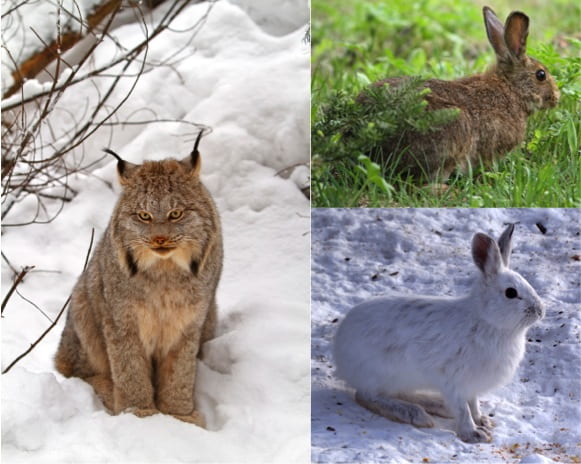
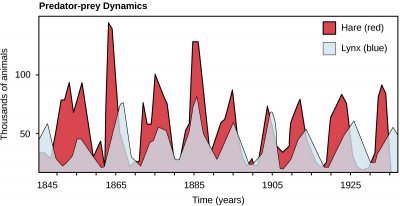
Strong predation on the hare populations reduces hare numbers, which in turn reduces lynx numbers. Predation results in continual co-evolution of traits for agility and speed in both species, as well as winter cryptic fur color in the hare against the snowy arctic background. Predation is in part responsible for the stable cycling of the population sizes of these two species, shown below.
If predators shape the traits of prey: Which hares are likely to survive the lynx? How might the survivors differ from those which died off in traits like camouflage, speed, or behavior?
This video reviews the population cycling that can occur in predator-prey interactions:
Community composition can be quantified for species richness and evenness
Take all those different interactions between species we just read about–competition, predation, mutualism, parasitism–mix them together in different assemblages, and the picture begins to seem much more complicated. How many species are in a community, are some more common and others more rare, and does that matter? Let’s think about two metrics of species diversity in a community assemblage: richness and evenness. Species richness, S, is simply a count of the number of species in a community. The skew, if any, in how common versus rare those different species are is captured by species evenness, which we’ll calculate using the Shannon diversity index,
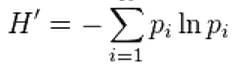
, where pi is the proportion of each species i in the community. Larger values of H’ indicate more evenness, which means the community is more diverse. Let’s break that down. Imagine that each box in the diagram below is an individual in a community, with the colors representing individuals of different species:

- What is S? (HINT: Count the number of species in the grid above)
- What is H’? (HINT: Calculate the proportion of each species and the natural log of that proportion, then plug in to the H’ equation.
- What if there were 10 of each color instead of the skew shown above?
- Which of these species might be a predator versus its prey?
Community stability is disproportionately controlled by two types of species: keystone species and dominant competitors
Communities are not random assemblages of species, and they are non-random because of interspecific interactions. Sometimes a single species, called a keystone species, serves as the unintentional lynchpin for stability of a complex set of community interactions. For example, the banded tetra, a fish in tropical streams, provides phosphorus to other species in the community (Source: OpenStax Biology). Sea otters are another example of keystone species: they live in kelp “forests” with a community of other species. The otters eat the sea urchins that graze on the floor around the kelp beds. When sea otter populations in the northern Pacific crashed after severe over-hunting, the sea urchins grazed the kelp to the point that the kelp forests, and the species that lived in them, largely disappeared. We’ll learn another example in class. The effect of a keystone is disproportionate to its biomass or population size. Critically, in most cases, the keystone species is neither the most numerous species nor the best competitor for resources in the ecosystem.
This video reviews several examples of keystone species and the outsized roles they play in their communities:
The Theory of Island Biogeography
MacArthur and Wilson (1963) put forth a theory to explain why ecologists could predict species richness on islands but could not predict the composition of those species. They started with the observation that there’s a very consistent log-linear relationship between habitat area and the number of (similar) species that tend to pack into that area, as can be seen here for reptiles and amphibians in the West Indies.
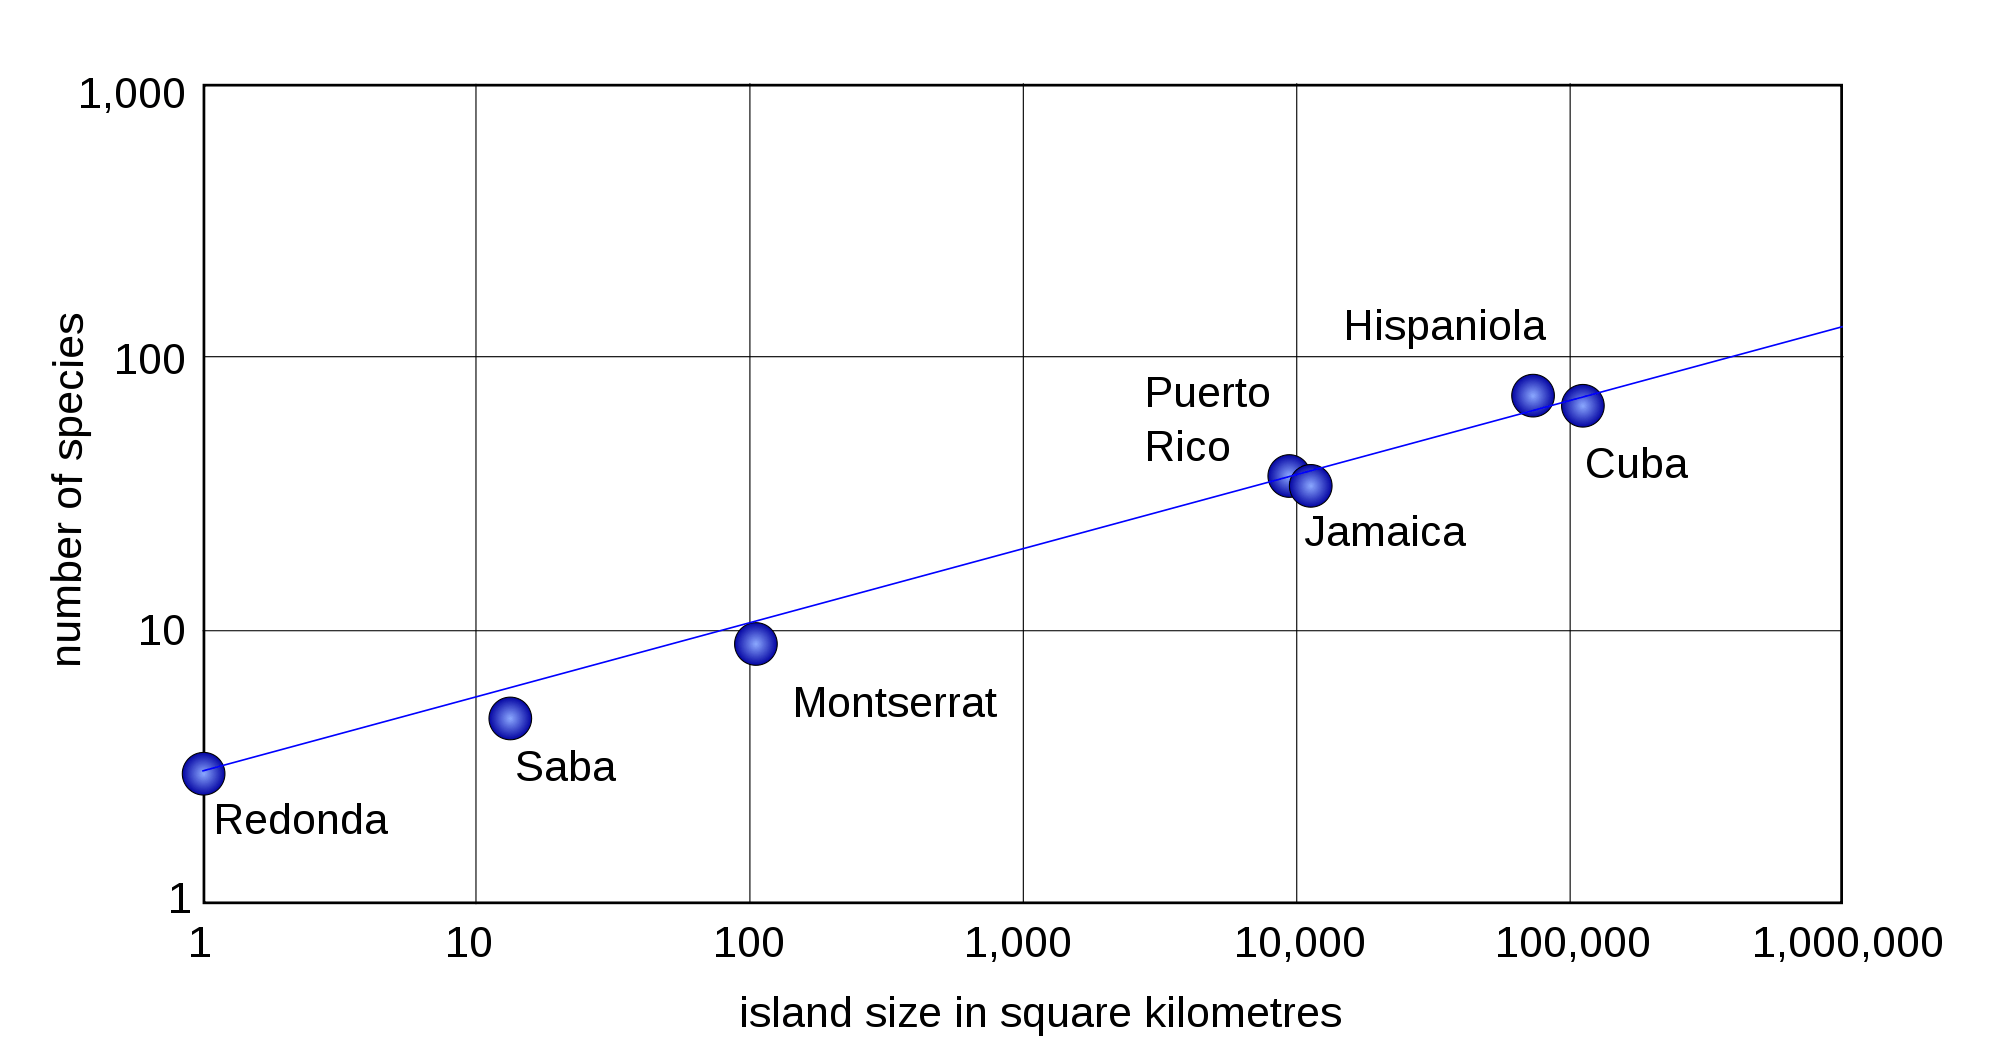
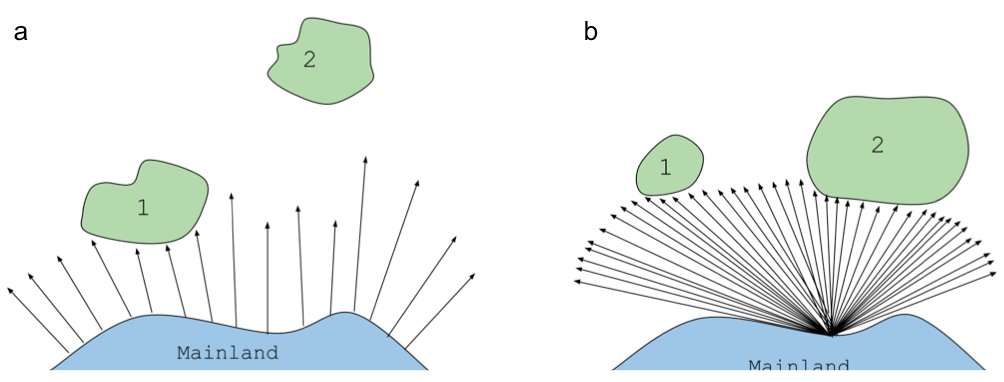
This species-area pattern is consistent for birds, mammals, and lots of other groups. MacArthur and Wilson assumed that
- more isolated islands have lower immigration rates (panel a in figure below)
- larger islands have lower “extinction” rates, and by extinction they meant loss of the species to the island. One way that a species can remain on the island is to re-migrate, which is more likely to happen by chance on larger islands (panel b in figure below)
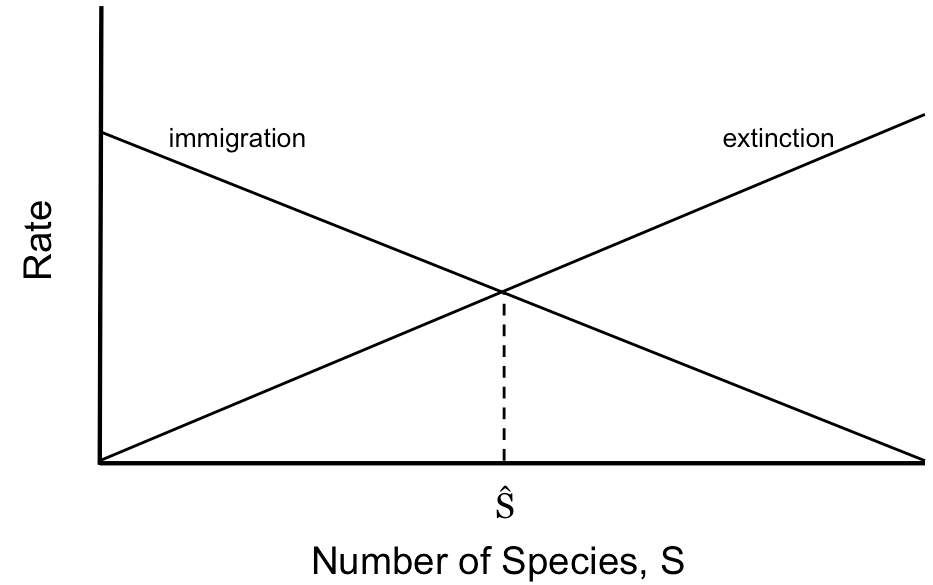
The intersection of the immigration and extinction rates for an island predict an equilibrium number of species, S-hat, assuming island size and island distance from mainland.
Here’s a short video that walks through basic island biogeography theory. The rescue and target effect concepts at the end provide a little more detail than we expect for this course:
UN Sustainable Development Goal

SDG 11: Sustainable Cities and Communities – The simple model of island biogeography can be applied to urban ecosystems to understand the factors that influence the diversity and composition of urban species. By considering the size and connectivity of urban green spaces, we can promote the development of more biodiverse and resilient urban communities.
