
Learning Objectives
- Explain that energy flows because usable energy is always lost as heat in biological processes, while matter cycles because matter is conserved
- Explain efficiency of energy transfer and its effect on the length of food chains
- Compare and contrast biomass and energy pyramids in different ecosystems
- Describe the major events in and interpret diagrams of the global cycling of water, carbon, and nitrogen
Energy flows but matter cycles
As enemies consume their victims in a community, they digest the matter of their victim and use some of it for energy for their own growth and reproduction. For instance, when a squirrel eats a seed, the transfer of energy is not efficient because squirrel tissue composition is very different from seed tissue composition (for example, plant cells have a cell wall, while animal cells do not). Much of the potential energy in the seed is spent in chemically processing the plant tissue, or it remains in the seed tissue as it moves through the squirrels digestive tract and is excreted into the environment. For the average trophic interaction, roughly 90% of energy is lost at each trophic level transfer, and this loss of energy to the consumer limits the length of food chains within a food web.
All the matter in living organisms, made up mostly of carbon, hydrogen, oxygen, and nitrogen in organic molecules, is either incorporated into the enemy that consumes it or left behind in the environment (see Frog Energy Flow Figure). Each atom ends up somewhere, as described in the nutrient cycles section below. The energy obtained by each organism is:
- used for maintenance of the organisms
- used for growth and reproduction
- lost as heat or excreted waste from the organism

This inefficient energy transfer from victim to enemy has population ecology implications. If only 10% of the energy makes it to the next trophic level, the population size of the top predator(s) remains small, while the population size and biomass of producers needs to be huge! In ecology, biomass is the combined mass of all the organisms of that species or group in the ecosystem. (Note that in the biofuel industry, the term biomass is used a little differently than in by an ecologist: ecologists refer to the entire organism, including roots and seeds, but biofuel biomass almost always refers to the mass of animal waste and harvested plant material used to make energy.)
While energy is transferred very inefficiently up a food chain, chemical toxins in the eaten organisms are incorporated into the consumer. Consumers eat many prey and retain all the toxins in those prey, accumulating higher toxin concentrations with each trophic position, a phenomenon called biomagnification (also called bioaccumulation).
While the energy pyramid for any ecosystem always narrows as the trophic levels increase (see Biomass and Energy figure below), the biomass pyramid can sometimes invert if the population ecology of the producers includes rapid generation times and little investment in building a physical body. For example, a single-celled aquatic algal species potentially reproduces every day, while a whale species cannot breed for several years after birth. Contrast that marine system with an aquatic system such as Silver Springs, Florida (see figure) where plant tissue includes grasses with lignin (an indigestible plant polymer) and roots from which many primary consumers cannot gain energy.

Elemental Cycles
What happens to a protein molecule in a plant seed that the squirrel consumes? Energy flows but matter cycles, meaning that matter is not lost the way that energy can leave the system as heat. Instead, matter is retained in some form in the ecosystem. Matter is stored in compartments such as carbon stored in rock, plants, the ocean, and the atmosphere, while the movement of matter between compartments is called flux. Carbon fluxes because of respiration, photosynthesis, decomposition, and burning.
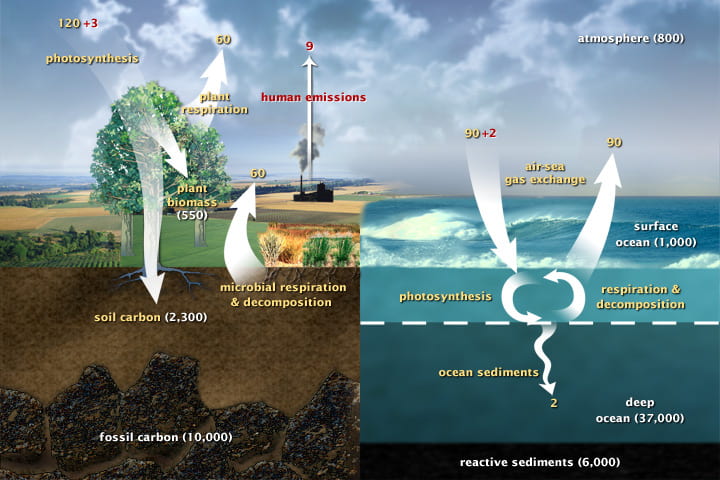
In the diagram above, carbon moves around when living (carbon-based) organisms eat or die. Carbon cycles quickly through individual organisms, but cycles very slowly through the environment. In fact, carbon in rock, which is the largest carbon compartment on Earth, often stays in the rock for millennia. Because the carbon in rock is unavailable for use, buried deep in the Earth, rock is called a “carbon sink.” Until recently, scientists could not account for all of the carbon that should be on Earth. Current evidence shows that more carbon is tied up in tropical forests than we had previously realized. So, tropical forests are the missing “carbon sink.” Tropical forests are being removed at a high rate to grow more lucrative if short term crops; tropical deforestation could add an additional disruption to the carbon cycle.
- How could changes to carbon usage reverse the current anthropogenic trend of more carbon being added to the atmosphere than is being removed?
The annual global pattern of carbon in the atmosphere (mostly in the form of CO2) is recorded at the Mauna Loa observatory in Hawaii.

The trend is for increase in CO2 over time — a dramatic increase. However, within each year the global atmospheric carbon cycles with a steady pattern that represents the global terrestrial photosynthesis, which occurs largely in the northern hemisphere during spring and summer, when photosynthesis reduces atmospheric CO2. You can see in the figure below that pCO2 rises in the fall-winter period (the intervals on either side of each year marker) and falls during the spring-summer period (the two middle intervals of each year).

In this video (starting at 5:17), Hank provides an overview of the carbon cycle and the relationship between human activity and global climate change:
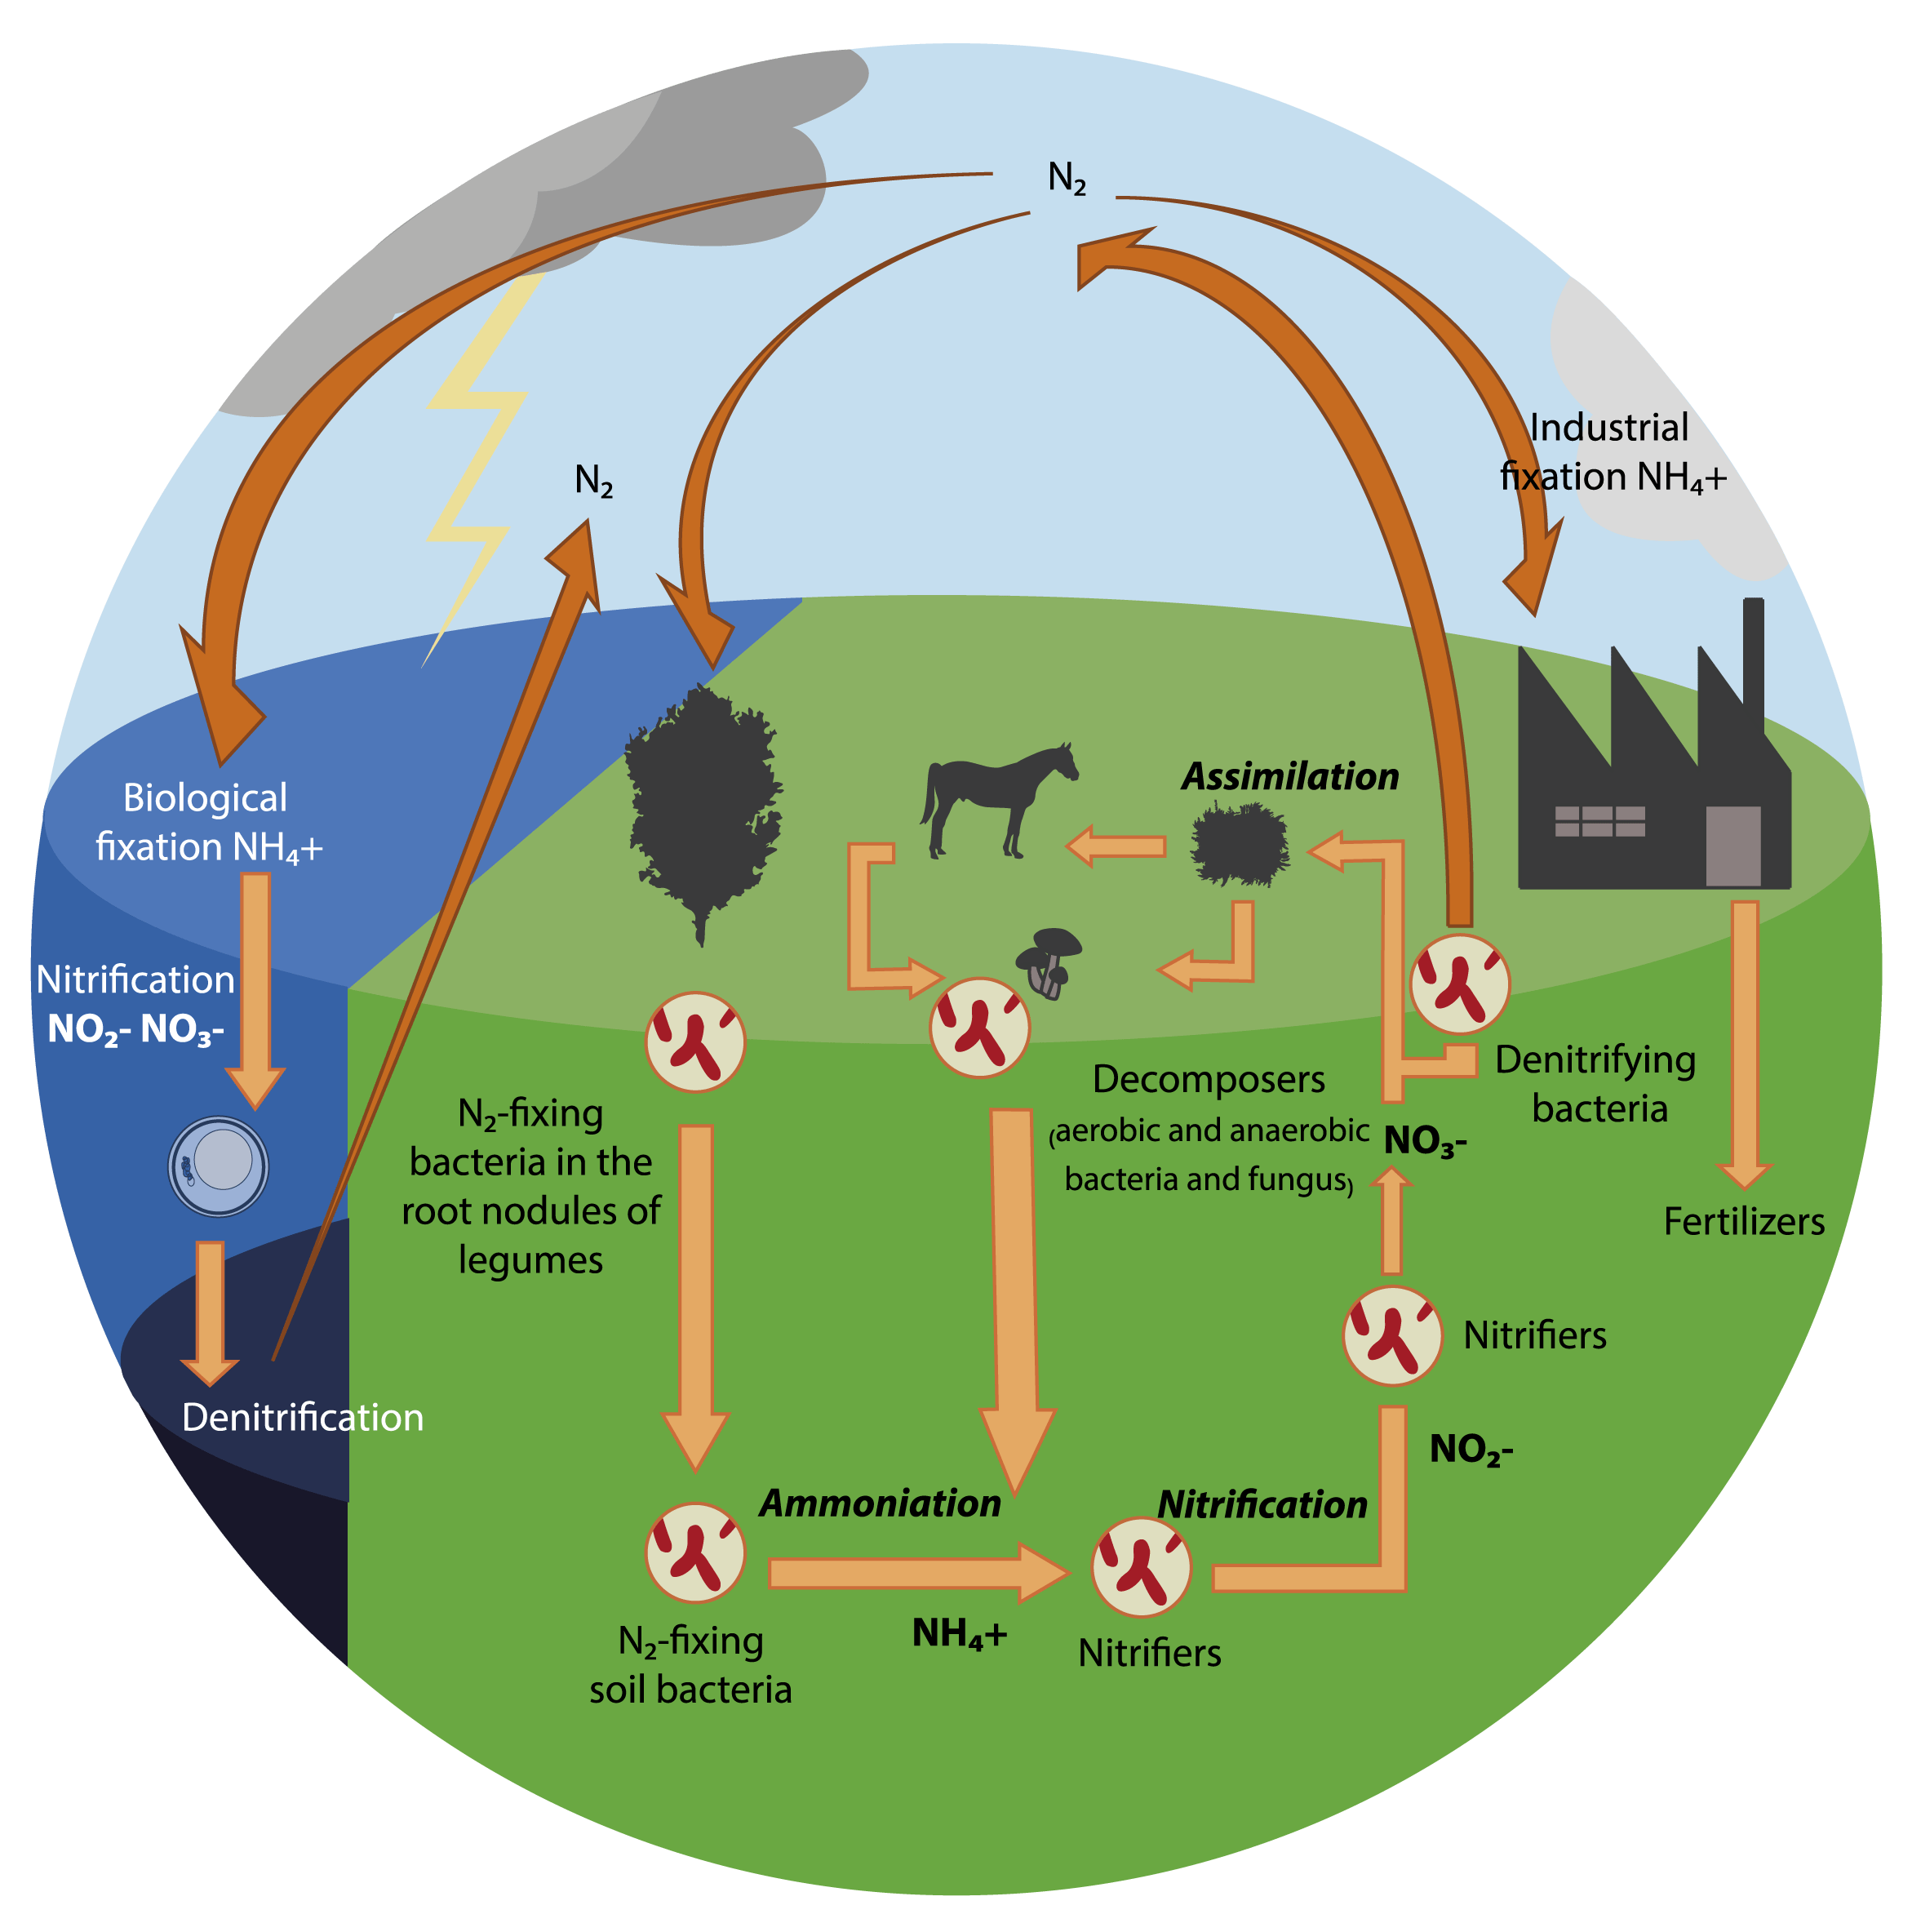
Other nutrients cycle between reservoirs. One critical example is nitrogen, which makes up 78% of the atmosphere as nitrogen gas, but which is not usable in that form by most living things. Nitrogen cycles via the processes of nitrogen fixation, ammonification, nitrification, assimilation, decomposition, and denitrification.
In this video, Hank describes the nitrogen and phosphorus cycles, two nutrients required for construction of biomolecules but which are mostly present in forms that are not “biologically available” (not in a chemical form that most organisms can use):
UN Sustainable Development Goal
SDG 7: Affordable and Clean Energy – Understanding the principles of energy flow and conservation is crucial for developing sustainable energy sources and reducing our reliance on non-renewable energy.
