Learning Objectives
- Explain nested relationships between individuals, populations, species, communities, and ecosystems
- Explain the how heat from the sun drives atmospheric circulation cells (e.g., Hadley) and predict the local, regional, and global effects if these forces change
- Explain how the Earth’s rotation (Coriolis effect) establishes prevailing winds and ocean circulation patterns, and predict the outcome should these forces change
- Predict how changes in temperature and precipitation patterns (climate) can alter species ranges and biome locations, and give an example of a biome
- Gives examples of how local geological features impact weather and nutrient cycling patterns
Ecology and its sub-disciplines
Ecology is the study of how organisms interact with their environment. These interactions range from how an individual responds to a stimulus (behavior), how individuals of the same species interact with each other (population ecology), how species interact with other species (community ecology), and how organisms interact with non-living components of the environment (ecosystem ecology). The entire set of interactions on a planet is called the biosphere.
Climate patterns affect where communities live in the biosphere
Where organisms live on the planet is governed by global scale processes caused by the orientation of the Earth’s axis toward the sun, heat retention versus loss in the atmosphere, and by the rotation of the Earth. The atmosphere-ocean system is a very, very large heat engine (refer to the Hadley Cell Cross-Section figure below). Sunlight input at the equator heats the water and air along the equator. Water becomes water vapor and rises with the heated air to up into the atmosphere (1). The rising air cools, causing precipitation in equatorial regions. The warm but dry air is pushed out of the way by the expanding hotter air below (2). Once it cools, the air falls back to Earth, this time without accompanying moisture (3). The high pressure created by the falling air redistributes to locations of lower pressure (4), such as the equator, establishing an air conveyor.
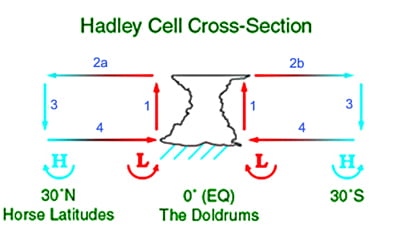
With respect to a Hadley cell, where should it rain? Where should deserts be?
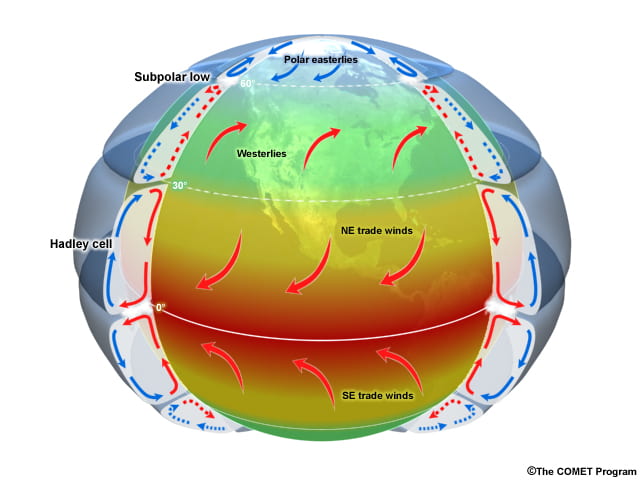
Scaled up to the entire, spherical planet, the Hadley cell and its companion cells at mid-latitudes and the poles establish significant north-south air and precipitation gradients. Because the Earth is rotating on its axis, the north-south patterns become disrupted by the Coriolis effect to establish the prevailing wind patterns seen as trade winds and westerlies in the figure below.
To help this make sense, here’s a fun video that use a kiddie pool experiment to explain the Coriolis effect, where the Earth’s spherical shape and rotation generate a curved path for water and air as they travel at the planet’s surface.
Consider how the Coriolis effect contributes to the westerlies and trade wind patterns at the Earth’s surface in the diagram below.
This video demonstrates the Coriolis effect and its influence on the direction wind moves in major storms:
And this video describes the relationship between global wind patterns and ocean currents:
Based on where these patterns of heat, wind, and precipitation, where do you predict the world’s deserts should be?
Biomes are defined by precipitation and temperature
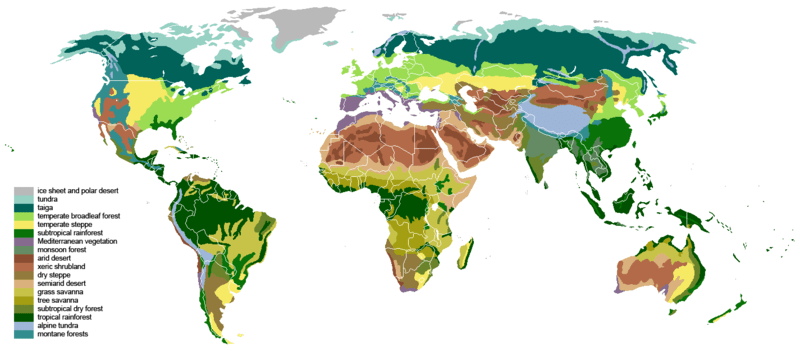
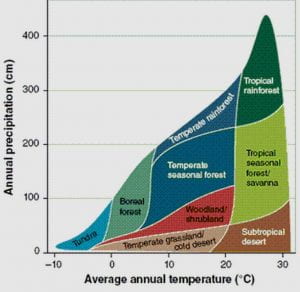
Deserts are one of many recurring ecosystems on the planet. When an ecosystem pattern recurs, we identify it as a biome and classify it according to temperature and precipitation profiles. Biomes can be terrestrial (shown below), aquatic, or marine.
This view of biomes arranged by their location on the planet allows us to see global community patterns, such as how deserts or forest communities are organized with respect to latitude. Interruptions to the this pattern occur when major geologic features run counter to latitude. For example, the Andes mountains in South America set up north-to-south biomes along the west coast, disrupting the east-to-west patterns evident in Africa.
This video reviews the relationship between the Hadley Cells and terrestrial biomes:
If we categorize biomes graphically along the axes of temperature and precipitation, then we can use the graphical organization to predict how environmental changes can alter the biome found in a specific location.
If a wet tundra biome experiences an increase in average annual temperature, what biomes would you predict the community in that location to shift to over time?
A terrestrial biome example: Temperate Forest
North Georgia, where Georgia Tech is located, is in the temperate forest biome, the most common biome in eastern North America, Western Europe, Eastern Asia, Chile, and New Zealand. Temperatures range between -30 °C and 30 °C (-22 °F to 86 °F) and drop to below freezing periodically during cold winters, defining growing seasons during the spring, summer, and early fall. Precipitation is relatively constant throughout the year and ranges between 75 cm and 150 cm (29.5–59 in).
Because of the moderate annual rainfall and temperatures, deciduous trees dominate. Deciduous trees lose their leaves each fall and remain leafless in the winter until new leaves appear as the temperature increases in spring. The trees of the temperate forests leaf out and shade much of the ground, soils that are rich in inorganic and organic nutrients caused by leaf litter on forest floors. As this leaf litter decays, nutrients are returned to the soil. The leaf litter also protects soil from erosion, insulates the ground, and provides habitats for invertebrates and their predators, such as salamanders.
Upwelling and turnover in aquatic biomes
In biomes governed by water, precipitation matters less while temperature and winds take on a more dominant role. One example of this is ocean upwelling, depicted in the figure below. Here, the wind pushes surface waters away from shore and create a zone of lower water pressure. Deeper waters well upward into that low pressure zone, and bring with them any nutrients settled to the ocean floor from decomposed dead organic matter.

In smaller freshwater aquatic systems, seasonal temperature change causes the greatest fluctuations in water temperature and water movement, called turnover. In winter, a lake or pond covered by surface ice has stratified temperature layers, and nutrients slowly settle to the bottom in the still waters. Water remains liquid to 0 degrees C, but it is most dense at 4 degrees C, so once the air temperatures rise in spring, the surface waters warm slightly and become more dense than the colder layer below. The dense surface waters sink, pushing the deeper, nutrient rich waters to the surface, and turning over the nutrients from bottom to top. Waters stratify again in the summer, and experience turnover again in the fall as surface temperatures drop down, making surface water more dense.
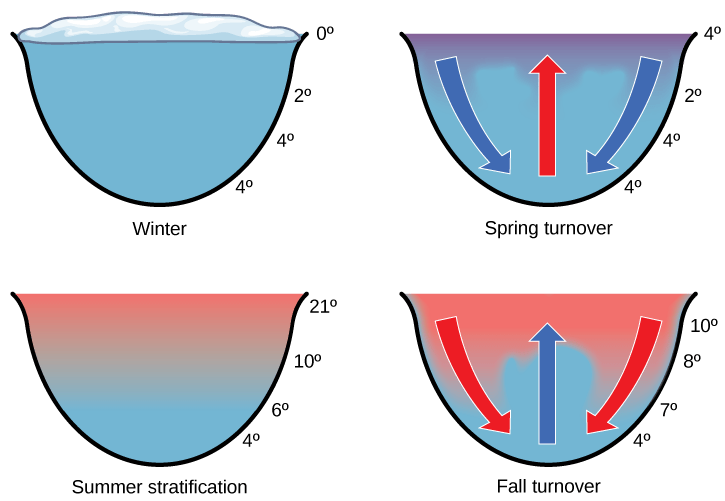
How would you relabel the temperatures in the diagram above so that they more accurately reflect the turnover process?
This video describes a rare, but catastrophic event that can occur in lakes that do not undergo seasonal turnover:

UN Sustainable Development Goal (SDG) 13: Climate Action – Urgent action is needed to effectively combat climate change and its impacts. Climate patterns, including temperature, precipitation, and wind, determine where communities and ecosystems are located on the planet, including the places (and inhabitants) most vulnerable to rapid changes in conditions. By understanding climate patterns and their effects, we can better address the challenges posed by climate change and devise mitigations.



A fun video on the Coriolis effect: http://www.smartereveryday.com/toiletswirl