Learning Objectives
- Use the fundamentals of stratigraphy to determine the order of fossils in a rock cross section diagram
- Use radiometric dating to calculate one of these, given the other two: the half life, amount of parent/daughter isotope, and age
- List and order key biological innovations and extinction events in the history of life on Earth, and describe the known evidence for these events
- Define adaptive radiation and mass extinction, and use examples to explain how environmental change, ecological opportunities, and/or key biological innovations can cause them
- Interpret figures showing oceanic and atmospheric oxygen over geologic time, and correlate oxygen levels to major events in the evolution of life on Earth
Geology, Earth history, and biological evolution
Evolution writ large, called macroevolution by biologists, takes a great deal of time. Natural selection will favor different genetic variants as geologic conditions change, such as climate, chemical composition, and sea level. A key of Charles Darwin’s thinking was his study and familiarity with the latest advances in the science of geology, including the works of Hutton and Lyell. And interpretation of the fossil record, and inferring the sequence of evolutionary changes, would be impossible without a grounding in the fundamentals of stratigraphy.
Fossils are found in sedimentary rocks
There are 3 different kinds of rocks:
- igneous rock formed from cooling of lava. Any organismal remnants are destroyed by the extreme heat of the lava.
- metamorphic rock whose crystal structure is altered by extreme heat and high pressure when buried miles deep in the Earth’s crust; may be formed from either igneous or sedimentary rock. Any fossils contained in sedimentary rock are destroyed during the transformation to metamorphic rock.
- sedimentary rock formed by deposition of fine sand and particles of organic and inorganic debris at the bottoms of oceans and lakes, compressed and often visible as layered rock formations. May contain fossils.
Dating and ordering the geological record
Stratigraphy, which is the order and relative position of rock layers and how they relate to the geological time scale, applies to sedimentary rock formations. The fundamental principle is that newer layers are always deposited on top of older layers. Under ideal conditions, a vertical dig reveals a historical record, with deeper digs revealing older sedimentary deposits. However, the Earth is dynamic, in that the movement of the Earth’s crust and geological uplifts may cause these layers to tilt, fold and even become inverted in some locations. In addition to crustal movement and uplift, erosion can remove layers of rock. These forces cause gaps in the sedimentary rock record called unconformities.
Radiometric dating
Stratigraphy reveals the order of geological events, but not their absolute dates. Depending on the age of the rocks or samples and their type, various radioisotope decay methods may be used to estimate the absolute ages of rocks found in different layers. Unstable elements called isotopes, like carbon-14 and potassium-40, are used to date rocks and fossils of different ages. Each isotope has a specific half-life, which is defined as the amount of time is takes for half of the sample to become the daughter element. For instance, carbon-14 (the parent) decays to nitrogen-14 (the daughter) with a half-life of 5700 years. In brief:
- Potassium-40 (K-40) decays to argon-40 (Ar-40); half-life = 1.26 billion years; used to date formation of igneous rocks. Ar-40 found trapped in the rock is compared to amount of K-40 remaining. A 1:1 ratio of K-40 to Ar-40 indicates the igneous rock has an age of 1 half-life, or 1.26 billion years.
- Uranium-238 (U-238) decays to lead-206 (Pb-206); half-life = 4.5 billion years; used to date zircons (see “How to Date a Planet” video above). Again, the ratio of U-238 to Pb-206 reveals how many half-lives have passed since the zircon crystal was formed.
- Carbon-14 (C-14) decays to nitrogen-14 (N-14); half-life = 5715 years; used to date organic matter. In this case, the amount of the daughter isotope (N-14) is uninformative, because N-14 is the common isotope of nitrogen and occurs at high levels in all organic matter and in the atmosphere. Instead, scientists measure the amount of C-14 compared to the amount of C-12. The ratio of C-14 to C-12 has been mostly constant over the last 100,000 years, so newly formed (by photosynthesis) organic matter starts out with a known ratio of C-14 to C-12 that is similar to the present-day atmospheric ratio of C-14 to C-12. Depletion of C-14 relative to C-12 is used to date the age of organic matter. After 5700 years, the ratio of C-14 to C-12 will be only half of the initial ratio of C-14 to C-12.

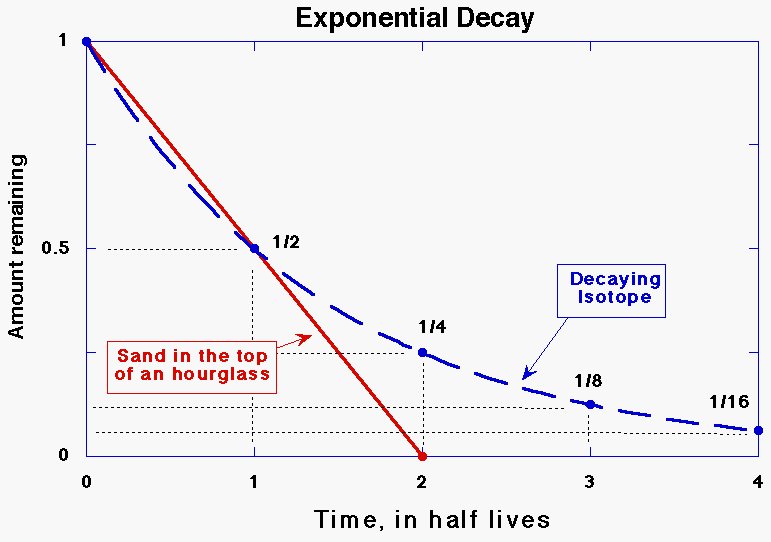
This figure shows exponential decay of a parent radioactive isotope, contrasted with the linear decrease of sand in an hourglass. For samples containing organic carbon, the fraction of C-14 remaining in the sample can be used to determine how many half-lives, and hence years, have passed since the organic matter was formed.
A common misconception is that scientists use carbon-14 to date rocks or fossils that are millions of years old, such as fossil dinosaur bones from 100 million years ago. Instead, scientists date igneous rocks found in layers above and below the sedimentary rocks containing the fossils. Why isn’t carbon-14 useful for dating fossil dinosaur bones?
Plate Tectonics and Continental Drift
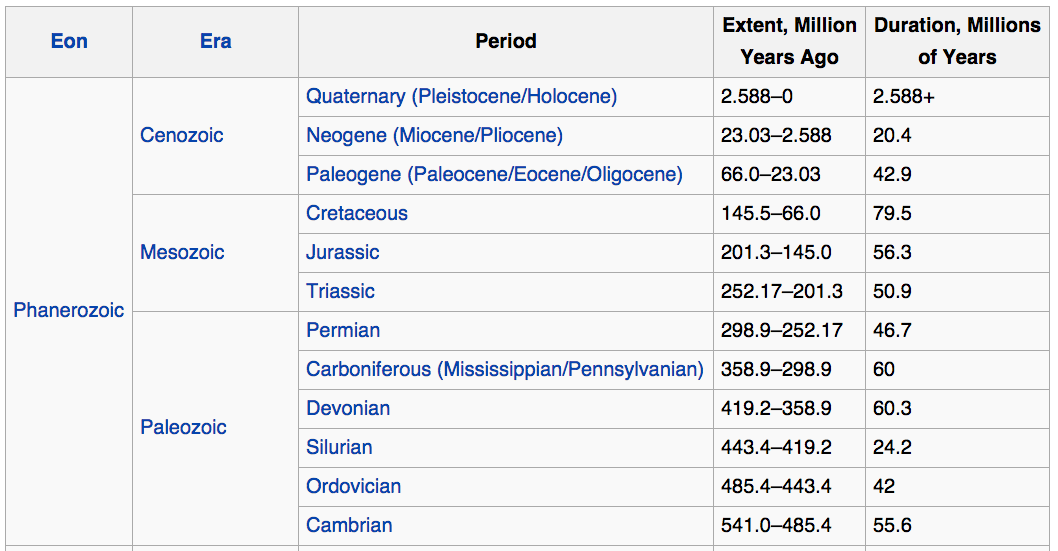
The major geologic periods that are important for diversification of life span the last 540 million years:
During this time the continents have been in constant motion across the surface of the Earth, splitting and merging. This video animation reconstructs continental movements for the last 560 million years:
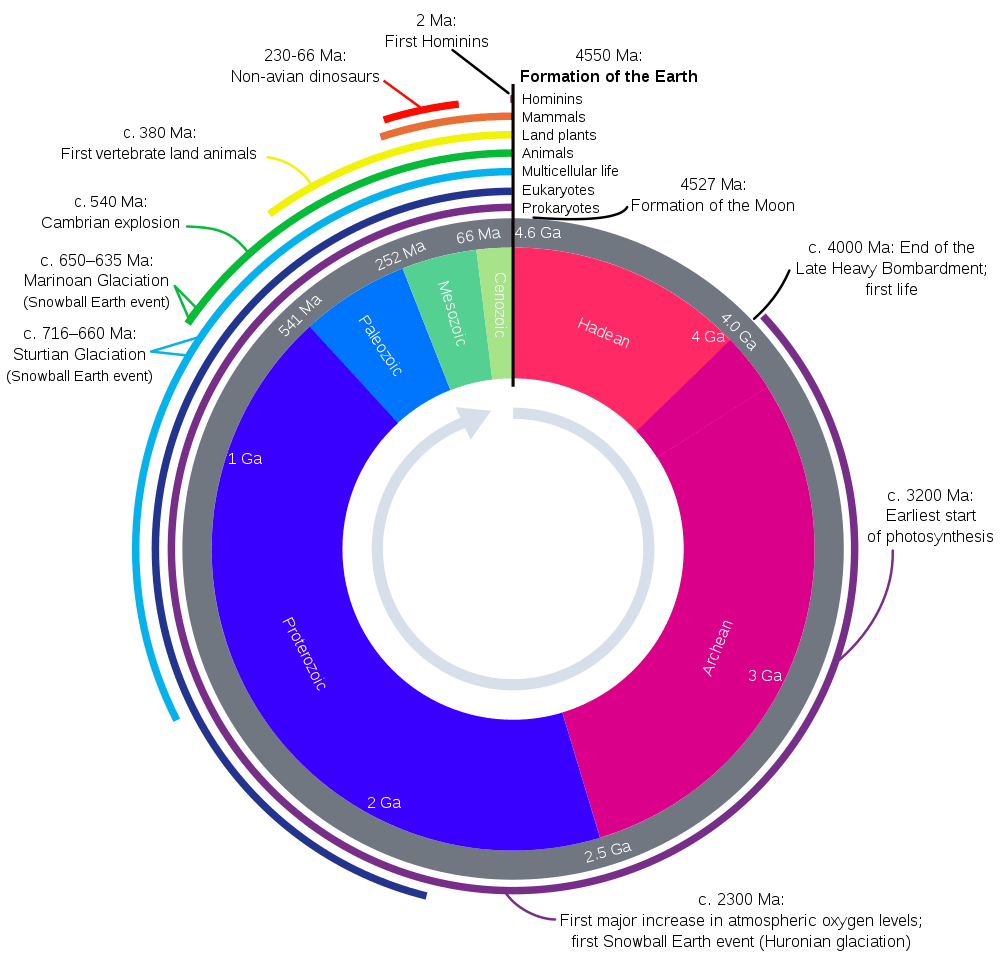
Often the major eras and periods of Earth history are arranged on a clock face in an effort to visualize the amount of time that has passed since each period, like this:

Here are some key milestones for this course:
- The oldest evidence for life is about 3.8 billion years old.
- While there was no oxygen in early Earth’s atmosphere or oceans, by about 3.5 Ga, we start seeing the first traces of O2 in the atmosphere. These increases in ocean and atmospheric oxygen levels become quite large with appearance of cyanobacteria about 2.7 billion years ago (Bya).
- The first eukaryotes appear in the fossil record after oxygen begins to accumulate about 1.5 BYA. Oxygen didn’t accumulate all at once, and evidence indicates that the oceans weren’t fully oxygenated until 850 milling years ago (Mya).
- Much of the life on Earth was singled celled until shortly before the Cambrian “explosion,” when we see emergence of all modern animal phyla. The Cambrian radiation (meaning rapid evolutionary diversification) occurred approx. 540 Mya. This is the first part of the Paleozoic (early animals) era.
- The largest mass extinction in the fossil record occurred at the end of the Permian period (299-252 Mya).
- The first mammals appear during the Jurassic period (200-145 Mya).
- Dinosaurs became extinct at the end of the Cretaceous period (145-66 Mya).
- The first apes appear in the fossil record about 25 MYA.
- The fossil Lucy (Australopithecus) dates to approximately 3 MYA.
- Modern Homo sapiens arise and migrate out of Africa, and then Neanderthals go extinct. Recorded human history occurs in the current Holocene epoch, from 11,700 years ago to the present. The Holocene epoch is the last part of the Quarternary period (2.59 Mya-present), which in turn is the last part of the Cenozoic era (66 Mya-present), which in turn is the last part of the Phanerozoic eon (540 Mya-present).
Co-evolution of life and the planet
The geochemistry of the Earth’s atmosphere, water and land surfaces have shaped the evolutionary history of life. And in turn, major changes in the biosphere have profoundly altered the chemistry of the Earth’s water, atmosphere, and land surfaces. The figure below shows milestones in the 4.5-billion year history of the Earth, changes in atmospheric oxygen levels, and the timing of the origin of microbial life and the origin of eukaryotes.

Image modified from: Brian Kendall, Department of Earth and Environmental Sciences, University of Waterloo
Adaptive Radiations
The Cambrian “explosion” refers to an increase in biodiversity of multicellular organisms at the start of the Cambrian, 540 million years ago. Multicellular life appeared only several tens of millions of years before the start of the Cambrian, as enigmatic fossils (Ediacaran biota) exhibiting body plans unlike present-day animals. These largely disappeared and were replaced by Cambrian fauna, whose variety includes all of the body plans found in present-day animal phyla. The appearance of Cambrian fauna span millions of years; they did not all appear simultaneously as the term “explosion” inaccurately implies.
Periods of increasing biodiversity and rapid speciation are called evolutionary radiations or adaptive radiations. They occur when new ecological niches become available, as after a mass extinction. They may also occur in response to an evolutionary innovation. One example would be the evolution of jaws. The ability to bite gave predators a huge advantage. Prey species adapted in a variety of ways, such as faster speed, body armor, defensive weapons such as horns and stingers, chemical defenses in the form of poison, larger body size, smaller body size, etc.
The Cambrian radiation also coincides with an increase in free oxygen to near-present day levels.

The increase in oxygen enabled the evolution of larger bodies and organs and tissues, such as brains, with high metabolic rates.
The increase in oxygen is a dramatic example of how life can alter the planet. Evolution of oxygenic photosynthesis changed the planet’s atmosphere over billions of years, and in turn caused radical shifts in the biosphere: from an anoxic environment populated by anaerobic, single-celled prokaryotes, to eukaryotes living in a micro-aerophilic (low-oxygen) environment, to multicellular-organisms in an oxygen-rich environment.
Human impacts are the latest in a succession of major evolutionary influences. We are now altering the planet with as yet undetermined consequences for life on Earth.
Oxygen
No other planet in our solar system has oxygen gas in the atmosphere. Oxygen is highly reactive, and quickly consumed by oxidation reactions. On Earth, oxygenic photosynthesis continually replenishes the oxygen consumed by respiration and other oxidative processes (e.g., rusting of iron, weathering of rocks). The history of oxygen gas in the Earth’s atmosphere sums up the history of life.
- The early Earth had no oxygen gas
- The evolution of water-splitting and oxygen-generating photosynthesis by cyanobacteria led to the first free oxygen dissolved in ocean waters about 2.6 billion years ago, which reacted with soluble iron and precipitated iron oxide (rust) from the oceans (now visible as banded iron formations in sedimentary rocks from that period).
- Oxygen dissolved in the water column led to more efficient (aerobic) metabolism, and eventually enabled the evolution of eukaryotes (around 2 BYA), and the first multicellular organisms (around 800 MYA).
- Oxygen gas in the upper atmosphere formed the ozone layer. The ozone layer absorbed harmful UV rays and allowed animals and plants to colonize land surfaces (350 MYA).
- Burial of large quantities of organic material in anaerobic sediments (eventually turning into coal and petroleum) allowed oxygen to accumulate in the atmosphere to present-day levels. Q: why is burial of organic carbon necessary for oxygen to accumulate in the atmosphere?
Here’s a link to an HHMI Interactive on the oxygen history on Earth. Select region 2 and click on “Howie” to step into an explanation of the two hypotheses of how oxygen outgassed into the atmosphere.
Temperature and sea level
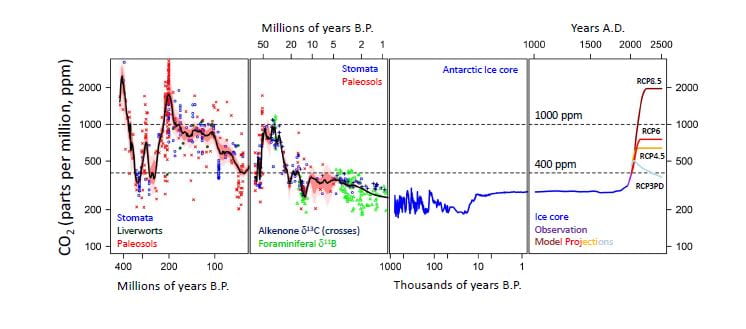
The Earth experienced large swings in global temperature, from “snowball” to hothouse, and intermittent glaciation. Note the conditions during the entire period of hominid evolution (circa 3 Mya) and recorded human history (circa 10 Kya). Also note the change in scale on the X axis (time).


Multiple factors caused these large swings in global temperature, including changes in solar output, extreme volcanic activity, meteor strikes, and atmospheric greenhouse gases, such as carbon dioxide. The figure above by Foster et al. shows that carbon dioxide levels above 400 ppm are now the highest in the past 10 million years.
Resources
Earthviewer app for tablets allows visualization of Earth through time
Another Youtube video explaining basic principles of stratigraphy
Land plants gave oxygen to predators
Radiometric Dating: A Christian Perspective a long and thorough, and yet very readable, explanation of how radiometric dating works, how the techniques are calibrated, the sources of error. The “Christian perspective” is about countering young-Earth misconceptions from any religious belief.
Recent papers of interest
M. O. Clarkson, S. A. Kasemann, R. A. Wood, T. M. Lenton, S. J. Daines, S. Richoz, F. Ohnemueller, A. Meixner, S. W. Poulton, E. T. Tipper. Ocean acidification and the Permo-Triassic mass extinction. Science, 2015 DOI:10.1126/science.aaa0193
UN Sustainable Development Goal

SDG 9: Industry, Innovation, and Infrastructure – Dating methods such as carbon-14 and potassium-40 are important tools for studying the history of life on Earth, and are used in other scientific fields such as archaeology and geology. The ability to accurately date rocks and fossils using various dating methods is essential for advancing scientific research, determining the location and viability of fossil-fuel-based industrial endeavors, and developing infrastructure projects that require knowledge of geological history.


So, from the youtube video, it’s predicted that the continents will merge back together?
Apparently so, but this is beyond my area of expertise.
Maybe only old farts like me will like this, but I do like it:
https://www.youtube.com/watch?v=EMwxwRA9Xr8
https://www.nytimes.com/2019/05/22/science/fungi-fossils-plants.html
Story about discovery of billion-year-old microfossils with morphology and chitinous cell wall of fungi, predating colonization of land by plants. What did these fungi eat?
https://www.trollart.com/wp-content/uploads/photo-gallery/imported_from_media_libray/Ages-of-Rock-CORRECT-copy.jpg?bwg=1543862013