Learning Objectives
- Define and recognize evolution by natural selection
- Explain predictions of and evidence for evolution by natural selection
- Recognize misconceptions applied to evolution by natural selection
- Interpret and construct phylogenetic trees as illustrations of evolutionary relationships.
Evolution by Natural Selection
Evolution by natural selection occurs when certain genotypes produce more offspring than other genotypes in response to the environment. It is a non-random change in allele frequencies from one generation to the next. In On the Origin of Species by Natural Selection (1859), Charles Darwin described four requirements for evolution by natural selection:
- the trait under selection must be variable in the population, so that the encoding gene has more than one variant, or allele.
- the trait under selection must be heritable, encoded by a gene or genes
- the struggle of existence, that many more offspring are born than can survive in the environment.
- individuals with different alleles have differential survival and reproduction that is governed by the fit of the organism to its environment
We can apply these postulates to consider whether evolution by NS is occurring in a specific case. Watch this TED Ed video of the evolution of antibiotic resistance in bacteria:
For bacterial evolution in the video, here’s how Darwin’s postulates apply:
- The population initially contains only antibiotic sensitive alleles, but mutations generate antibiotic resistant alleles. Now the trait under selection (antibiotic resistance) is variable in the population, with two alleles.
- The antibiotic resistant individuals have offspring that are also resistant because they have the same gene mutation for resistance, indicating that the trait is heritable.
- Both sensitive and resistant bacteria have lots of offspring inside the infected human host and compete for resources inside the host.
- Because the human host is taking a course of antibiotics, bacteria with the sensitive alleles die moreso than bacteria with the resistant allele. The resistant bacteria are a better fit to the antibiotic-rich environment.
This brings us to the idea of Darwinian fitness, that the organisms that best match their environment will have relatively greater survival and reproduction than those that match less well. The resulting trait that is heritable and increases the survival and reproduction odds for those that carry that trait is called an adaptation. Of the mechanisms of evolution we’ve learned in this course, only natural selection results in adaptations.
Common mistakes in thinking about Evolution by Natural Selection
Here are some common misconceptions about evolution by natural selection:
- The individual undergoing natural selection does not evolve–it just lives or dies! Instead, the population of organisms is evolving. Recall that evolution is the change in allele frequencies, and only populations have allele frequencies. Individuals just have alleles.
- Evolution is not a directed process with a fixed end point, or a best phenotype. Rather, the environment serves as a selective agent. No amount of planning on the part of the organism can predict whether an organism will be a good fit for the environment it finds itself in.
- Organisms, and the genes they contain, do not behave for the ‘good of the species.’ Rather, each individual lives and reproduces, which increases its representation in the gene pool, or it dies or fails to reproduce and is not represented in the gene pool. Those most represented after encountering a selective agent are considered the “most fit” for that environment, in that time and place.
- Selection doesn’t always result in the best possible fit of an organism to its environment because of constraints and trade-offs. Sometimes the same genes that code for a trait also cause a second, suboptimal trait to occur.
Does evolution of bigger, sexually reproducing organisms happen on time scales faster than geologic time?
Yes! There are lots of great examples of evolution, even in sexually reproducing species, that happen pretty quickly, on the order of years or decades. In fact, the relevant time unit is generations. Rock Pocket mice in the desert southwest are a long-studied example. These small tan mice are hunted by owls, visual predators who spot the mice by their contrasting color against the sand. Most mice are exactly the same color as the sand. This short video explains what happens to a pocket mice population that migrates onto black volcanic rock, with mutation rates and the number of generations until the population shifts from all tan to all black coat color.
Examples of how evolution matters to ordinary people
- The example of bacteria evolving resistance to antibiotics is just one example of how evolution affects people’s lives. Here are some questions for you to consider in the light of evolution:
- How is cancer an evolutionary disease? Cancer arises because individual cells acquire mutations that they pass on to their progeny via mitosis. These mutations allow these cells to escape growth inhibition and hog resources (by creating new blood vessels and ramping up metabolism).
- When we use insecticides in hour homes, and farmers spray their fields, how will the targeted insect population evolve?
- When fishing regulations limit the catch to larger fish, what consequences might that have?
Evolution occurs in us and all around us, because life evolves.
Phylogenetic trees
Evolutionary biologists diagram evolutionary relationships among organisms using phylogenetic trees. The diagram below shows a tree of 3 taxa (a singular taxon is a taxonomic unit; could be a species or a gene).

modified from https://evolution.berkeley.edu/evolibrary/article/phylogenetics_02
This is a bifurcating tree. The vertical lines, called branches, represent a lineage, and nodes are where they diverge, representing a speciation event from a common ancestor. The trunk at the base of the tree, is actually called the root. The root node represents the most recent common ancestor of all of the taxa represented on the tree. Time is also represented, proceeding from the oldest at the bottom to the most recent at the top. What this particular tree tells us is that taxon A and taxon B are more closely related to each other than either taxon is to taxon C. The reason is that taxon A and taxon B share a more recent common ancestor than they do with taxon C.
A common mistake is to read the tips of the trees and think their order has meaning. In the tree above, the closest relative to taxon C is not taxon B. Both A and B are equally distant from, or related to, taxon C. In fact, switching the labels of taxa A and B would result in a topologically equivalent tree. It is the order of branching along the time axis that matters. The illustration below shows that one can rotate branches and not affect the structure of the tree, much like a hanging mobile:

https://evolution.berkeley.edu/evolibrary/article/%3C?%20echo%20$baseURL;%20?%3E_0_0/evotrees_primer_08
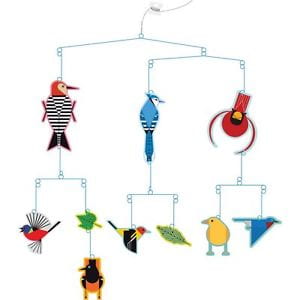
Hanging bird mobile by Charlie Harper
Students also have difficulty interpreting how the trees model evolutionary relationships. One thing to remember is that any tree represents a minuscule subset of the tree of life.
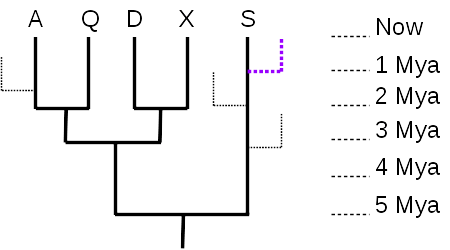
An ultra-metric tree of 5 taxa (A, Q, D, X, S) with evolutionary time shown in millions of years ago (Mya). The purple dotted line represents an evolutionary lineage with currently living taxa not represented in the 5-taxon tree. The fine dotted lines indicate a few evolutionary lineages that have gone extinct. Diagram is original work of Jung Choi
Given just the 5-taxon tree (no dotted branches), it is tempting to think that taxon S is the most “primitive” or most like the common ancestor represented by the root node, because there are no additional nodes between S and the root. However, there were undoubtedly many branches off that lineage during the course of evolution, most leading to extinct taxa (99% of all species are thought to have gone extinct), and many to living taxa (like the purple dotted line) that are just not shown in the tree. What matters, then, is the total distance along the time axis (vertical axis, in this tree) – taxon S evolved for 5 million years, the same length of time as any of the other 4 taxa. As the tree is drawn, with the time axis vertical, the horizontal axis has no meaning, and serves only to separate the taxa and their lineages. So none of the currently living taxa are any more “primitive” nor any more “advanced” than any of the others; they have all evolved for the same length of time from their most recent common ancestor.
The time axis also allows us to measure evolutionary distances quantitatively. The distance between A and Q is 4 million years (A evolved for 2 million years since they split, and Q also evolved independently of A for 2 million years after the split). The distance between A and D is 6 million years, since they split from their common ancestor 3 million years ago.
Phylogenetic trees can have different forms – they may be oriented sideways, inverted (most recent at bottom), or the branches may be curved, or the tree may be radial (oldest at the center). Regardless of how the tree is drawn, the branching patterns all convey the same information: evolutionary ancestry and patterns of divergence.
A group of taxa that includes a common ancestor and all of its descendants is called a clade. A clade is also said to be monophyletic.

from https://evolution.berkeley.edu/evolibrary/article/side_0_0/evo_06
Questions about any of this? Login to add your comments below.
Additional optional readings
https://evolution.berkeley.edu/evosite/relevance/IApathogens.shtml
https://evolution.berkeley.edu/evosite/relevance/IA1antibiotics.shtml
https://evolution.berkeley.edu/evolibrary/article/phylogenetics_02

Updated 9/6/2015 with revised figure of 3-taxon tree showing root node, added paragraph on branch rotation with figure of equivalent trees after branch rotation, and illustrative hanging mobile.
Updated 9/7/2015 with section on evolutionary distance with figure of tree with time and dotted lines representing extinct lineages and branches otherwise not represented on a hypothetical 5-taxon tree.